Overall
1. Wind Vector& Temperature Contour
2. Vertical Temperature Contour
3. Wind Contour (U-wind, W-wind)
4. Average Temperature Series
1. Wind Vector & Temperature Contour
Senerio
2024
2100 SSP2-4.5
2100 SSP5-8.5
Urban Size


When the heat island begins to form, vertical air convection is suppressed.
When the heat island dissipates, vertical air convection becomes more active.
2. Vertical Temperature Contour
Vertical Temperature with Height under 1000m
Senerio
2024
2100 SSP2-4.5
2100 SSP5-8.5
Urban Size


The urban heat island effect is strongest around 6 a.m.
After the urban heat island effect dissipates, surface cooling occurs.
3-1. Wind Contour - U wind
Senerio
2024
2100 SSP2-4.5
2100 SSP5-8.5
Urban Size


When the temperature rises in the urban center due to the urban heat island effect, surrounding air flows into the urban center, causing convergence in the lower layers. Then the winds entering from the edges of the urban into the center appear to come from opposite directions, west and east, with one side appearing in deep red and the opposite side in deep blue.
3-2. Wind Contour - W wind
Senerio
2024
2100 SSP2-4.5
2100 SSP5-8.5
Urban Size


When the temperature in the urban center rises due to the urban heat island effect, the air converged into the urban center begins to rise. This creates an upward flow, forming a yellow dome-shape.
4. Average Temperature Series
500m and Surface Temperature
Urban Size
![[500m] lm10.png](https://static.wixstatic.com/media/d25d3e_c438fac8931c418db252443e78680e5d~mv2.png/v1/fill/w_567,h_259,al_c,q_85,usm_0.66_1.00_0.01,enc_avif,quality_auto/d25d3e_c438fac8931c418db252443e78680e5d~mv2.png)
![[500m] lm25.png](https://static.wixstatic.com/media/d25d3e_c81179bdee5948339702740a96bbc612~mv2.png/v1/fill/w_567,h_259,al_c,q_85,usm_0.66_1.00_0.01,enc_avif,quality_auto/d25d3e_c81179bdee5948339702740a96bbc612~mv2.png)
![[500m] lm40.png](https://static.wixstatic.com/media/d25d3e_2638ebbfc060471dbee911e4d3e79933~mv2.png/v1/fill/w_567,h_259,al_c,q_85,usm_0.66_1.00_0.01,enc_avif,quality_auto/d25d3e_2638ebbfc060471dbee911e4d3e79933~mv2.png)
Urban Size

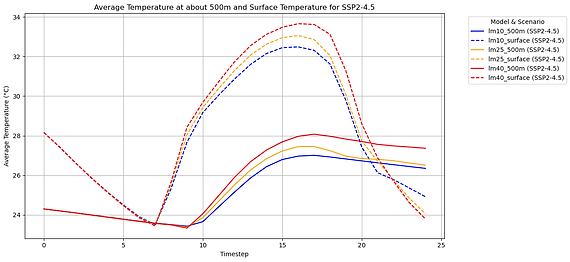

As the urban size increases, the average temperature in each SSP scenario rises by approximately 1°C, with the urban heat island effect extending up to the UBL layer. On the other hand, the rate of temperature change over time is more pronounced within the UCL layer.
(+) 1000m and Surface Temperature
![[1000m] lm10.png](https://static.wixstatic.com/media/d25d3e_9b12ac706cff41fd97d0b10d22980386~mv2.png/v1/fill/w_488,h_224,al_c,q_85,usm_0.66_1.00_0.01,enc_avif,quality_auto/d25d3e_9b12ac706cff41fd97d0b10d22980386~mv2.png)
![[1000m] lm25.png](https://static.wixstatic.com/media/d25d3e_4777c89464b243139640a405be97a1ac~mv2.png/v1/fill/w_488,h_224,al_c,q_85,usm_0.66_1.00_0.01,enc_avif,quality_auto/d25d3e_4777c89464b243139640a405be97a1ac~mv2.png)
![[1000m] lm40.png](https://static.wixstatic.com/media/d25d3e_95887191fd8d47f8aad593766099a361~mv2.png/v1/fill/w_488,h_224,al_c,q_85,usm_0.66_1.00_0.01,enc_avif,quality_auto/d25d3e_95887191fd8d47f8aad593766099a361~mv2.png)
Additionally, when analyzing the temperature at 1000m, it was found to follow a trend very similar to that at 500m.