Case Settings
1. Urban Size settings
2. Land type settings
3. New Temperature Input Data settings
4. Time settings
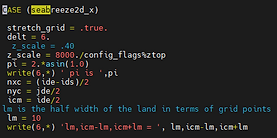
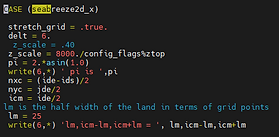

1. Urban Size Settings
Regional Horizontal Size
-
(east, west) = (1, 100)
Regional Vertical Size
-
(south, north) = (1, 3)
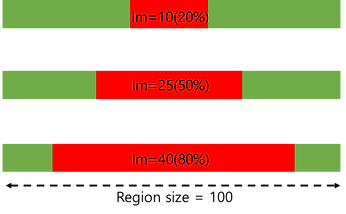
Urban Size
-
half the length of a city (lm, length meters): 10(20%) 25(50%), 40(80%)
2. Land Type Settings
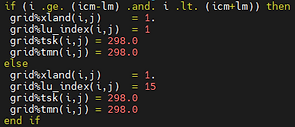
Urban type setting (1)
-
grid type: land (1)
Urban surroundings setting (15)
-
Since 62.6% of the land on the Korean Peninsula consists of mountainous areas, we selected the 'mixed forests' as types of land other than cities.
3-1. New Input Data
New Temperature Data according to Climate Change Scenario
It is highly likely that the urban heat island effect (UHI) will be amplified due to climate change caused by the emission of greenhouse gases. Currently, abnormal climate phenomena are occurring frequently and the direct and indirect effects on human life are increasing. We thought that looking at the intensity of urban heat islands according to climate change would alert us and lead to meaningful conclusions, so we looked at changes in the effect of heat island intensity by city length according to climate change scenarios.
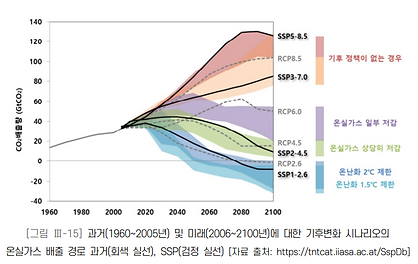
As the IPCC(Intergovernmental Panel on Climate Change) predicts future climate change based on the SSP scenario in the 6th evaluation report, we adopted SSP2-4.5 and SSP5-8.5 among SSP scenarios. The shared socio-economic pathways (SSP) scenario represents not only the degree of radiation coercion as of 2100 but also quantitative changes in future socioeconomic indicators depending on climate change adaptation and greenhouse gas reduction.
-
SSP2-4.5
-
Assume that the degree of climate change mitigation and socio-economic development is moderate (significantly reduced greenhouse gases)
-
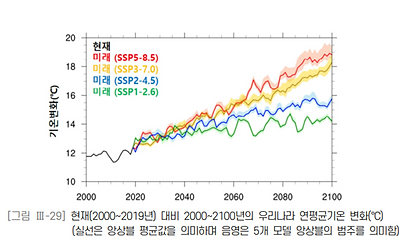
Average annual temperatures are expected to rise by approximately +1.2 degrees in the first half of the 21st century compared to the present and by approximately +3.5 degrees in the second half (detailed South Korean standards)
2. SSP5-8.5
-
Presuming high fossil fuel use and reckless urban development expansion centered on rapid development of industrial technology (high carbon scenario)
-
Average annual temperatures are expected to rise by approximately +1.4 degrees in the first half of the 21st century compared to the present, and by approximately +6.3 degrees in the second half (detailed South Korean standards)
3-2. Calculation Method of New Temperature Input Data
To reflect the temperature for each scenario, we used the annual average temperature data for Seoul provided by the Korea Meteorological Administration's regional climate change scenarios (http://www.climate.go.kr/home/CCS/regionclimate/main_view.html).
Step 1. Calculation of Atmospheric Pressure According to Altitude
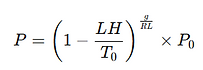
We calculated the atmospheric pressure according to altitude using the equation based on the International Standard Atmosphere (ISA). In this calculation, we assumed the atmosphere to be an incompressible ideal gas in thermodynamic equilibrium in the vertical direction. The temperature (T) change with altitude (H) was taken into account for altitudes within the lower atmosphere (troposphere, up to 11 km).
(Eq.1)

Step2. Calculation Temperature with Potential Temperature & Atmospheric Pressure
Step2-1. Calculation of temperature by altitude using initial potential temperature data
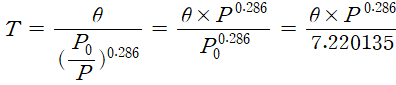
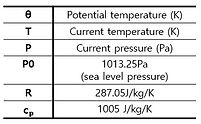
The temperature was calculated using the Poisson equation derived from the first law of thermodynamics and the ideal gas equation.
(Eq.2)
*Potential temperature: Temperature of air with P(hPa), T(K) is moved adiabatically to P0=1013.25hPa, preserved during adiabatic process of dry air
Step 2-2. Calculation of New Temperature by Altitude According to Climate Change Scenarios
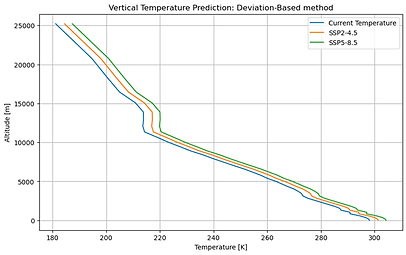
Since the data we use are ideal data, several new temperature calculation equations were derived under the assumption that the rate of temperature increase or decrease due to an increase in greenhouse gas is constant and that the temperature decreases linearly at a low altitude (troposphere). Among them, we tried to adopt an equation that supports well the theoretically known results empirically.
-
Temperature Deviation Calculation
[SSP2-4.5] 2024: 14.1°C (287.15K) → 2100: 17.4°C (290.55K) => Deviation: 3.3°C
[SSP5-8.5] 2024: 14.9°C (288.05K) → 2100: 21.1°C (294.25K) => Deviation: 6.2°C
(Temperature Equation 1, Graph 1) (Temperature Equation 2, Graph 2)
SSP2-4.5: SSP2-4.5:
SSP5-8.5: SSP5-8.5:
In practice, there was little difference between the results derived using temperature deviation and those calculated using the rate of change. However, since the temperature values we obtain from regional climate change scenario websites represent annual average temperatures, but the surface temperature for the given input data is 24.84°C, which corresponds to a summer temperature. So it seems more appropriate to use the deviation from the scenario to calculate the new temperature values. Therefore, we chose to adopt the formula based on the temperature deviation.

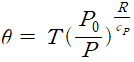
Step3. Conversion to Potential Temperature from New Calculated Temperature
For the newly calculated altitude-specific temperature data for each scenario, we also performed an additional calculation to convert the temperature back to the potential temperature using the Poisson equation.
(Eq.3)
[New Temperature Input Data (input.sounding)]

▲ Current Input Data

▲ SSP2-4.5 Input Data
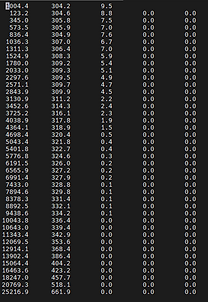
▲ SSP5-8.5 Input Data
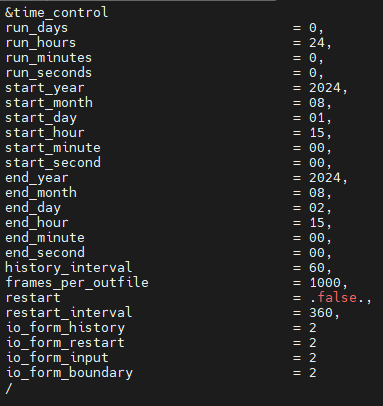
4. Time Settings
Selecting mixed forests option (15)
-
Year setting
According to the climate change scenarios, the current year is set to 2024, and the SSP2-4.5 and SSP5-8.5 scenarios are set to 2100. -
Month setting
From a seasonal perspective, the urban heat island effect is stronger in summer than in winter. To visually highlight the urban heat island effect, we set the month to August, which corresponds to summer. -
Time Setting
The intensity of the urban heat island effect changes over time. After sunset, the heat island effect rapidly intensifies, reaching its peak 3 to 5 hours later. Additionally, heat accumulates during the day and is released at night, so there is a difference in intensity between day and night. To make a visual comparison of the period when the urban heat island effect is strongest, the time frame was set from 3 PM on the current day to 3 PM the following day.